Infographics, Illustration, & Data Visualization
One of my favorite things is taking complex content and visually mapping it out, so that people can understand something in context.
Many more examples available upon request, including examples within the UI section of this site, demonstrating dynamic and interactive data visualizations.
WestEd

Federal Funding for Education in response to COVID

Breakdown of the American Relief Plan’s requirements for spending


Colors are based on the California School Dashboard ratings

Infographic describing a process model for change management

Process illustration

Process diagram, including dynamic thumbnail that appears on all individual stages to remind the user where in the process they are
WestEd’s Center for the Future of Teaching and Learning — California Insights
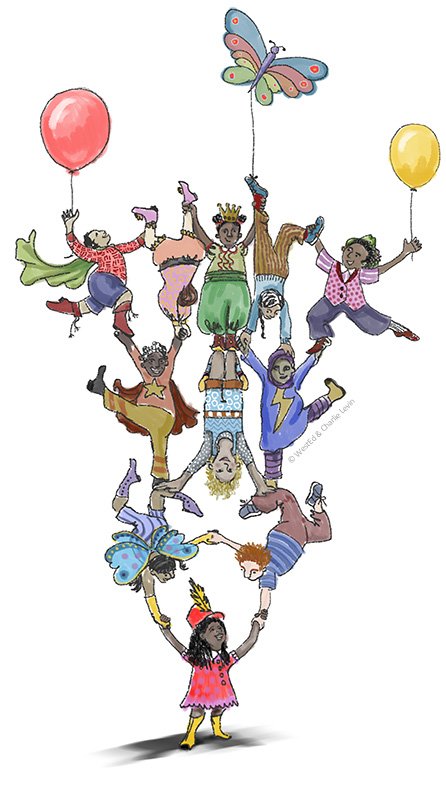
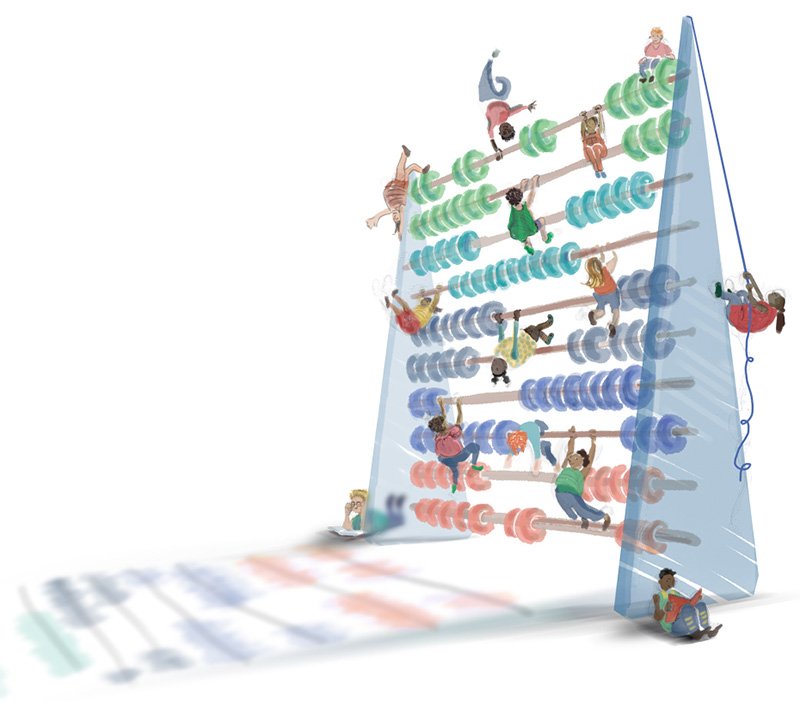
A series of reports with hand-drawn illustrations sharing insights from a state-wide survey of educators on funding, implementation of state standards, professional learning, use of instructional materials, and leadership.


Page from a public-facing report of a county’s status regarding alcohol, drugs, and wellness

Page from a public-facing report of a county’s status regarding alcohol, drugs, and wellness
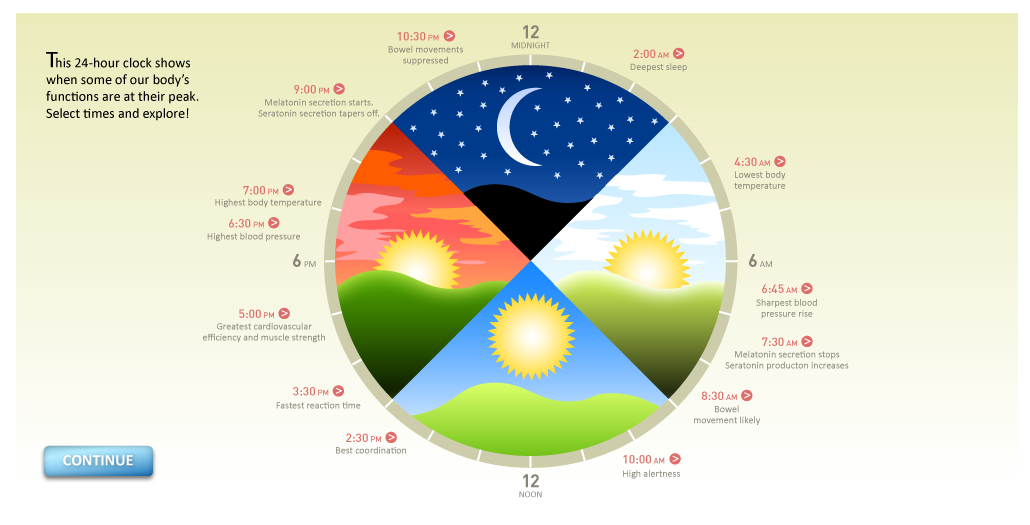
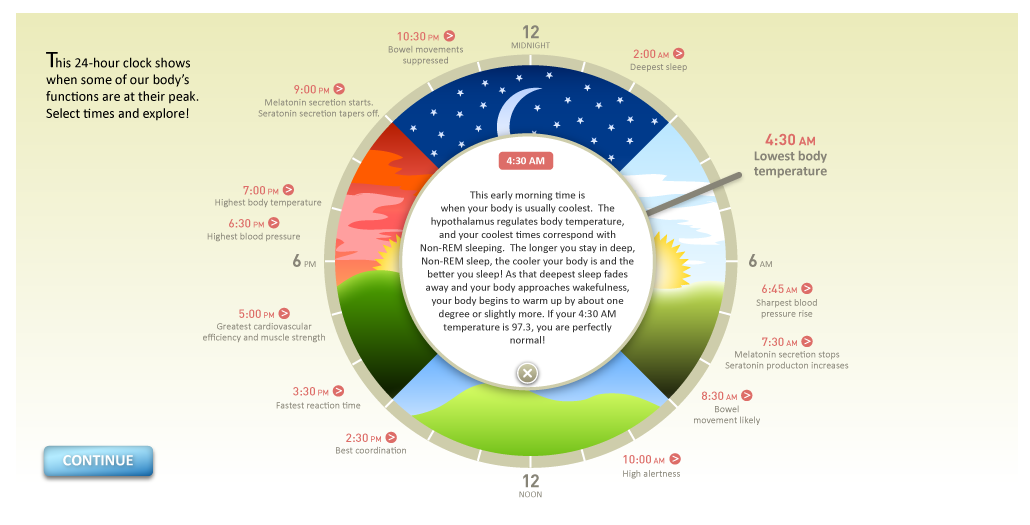
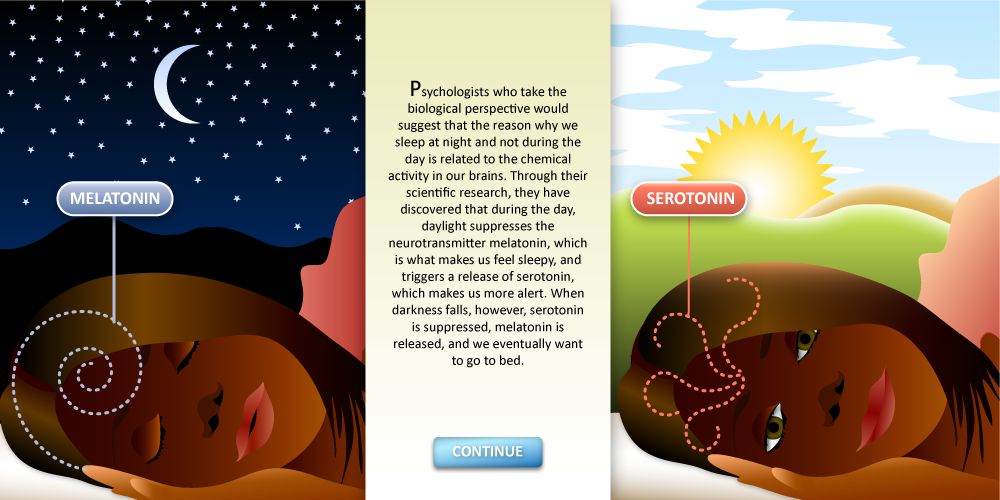
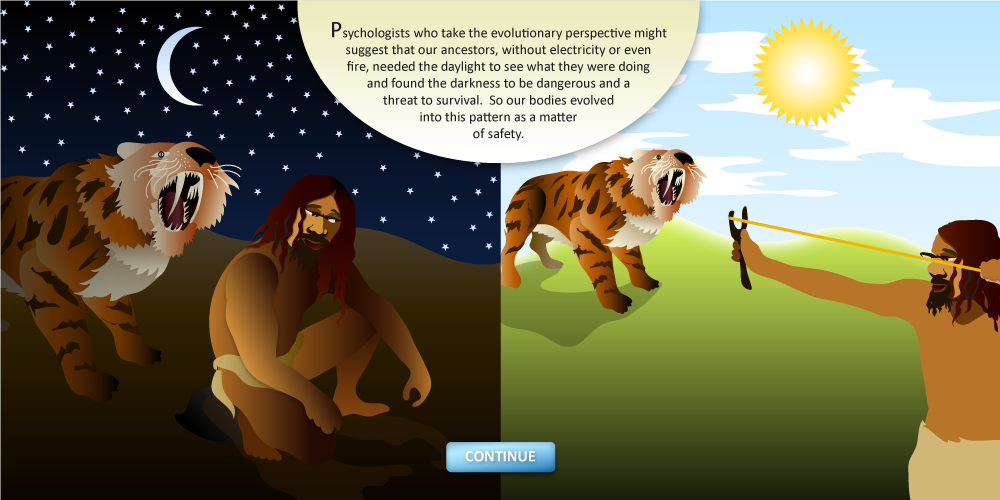
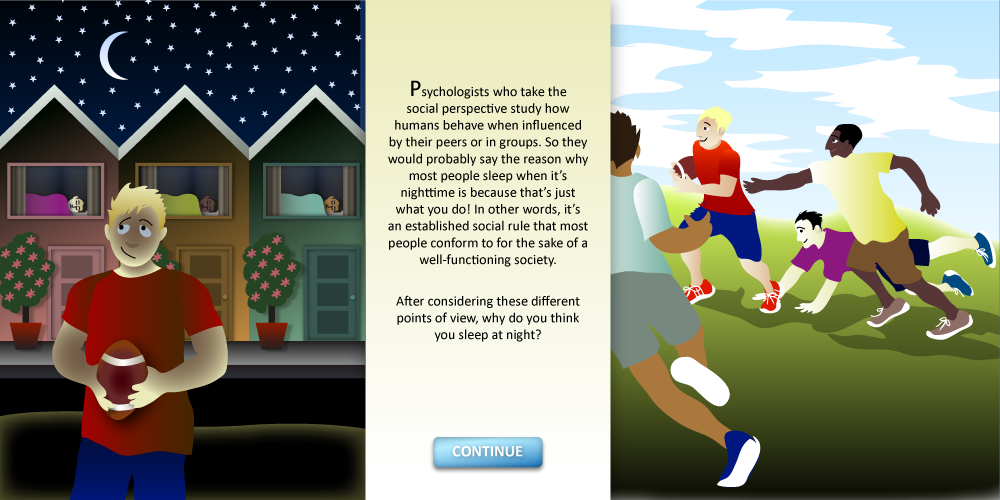
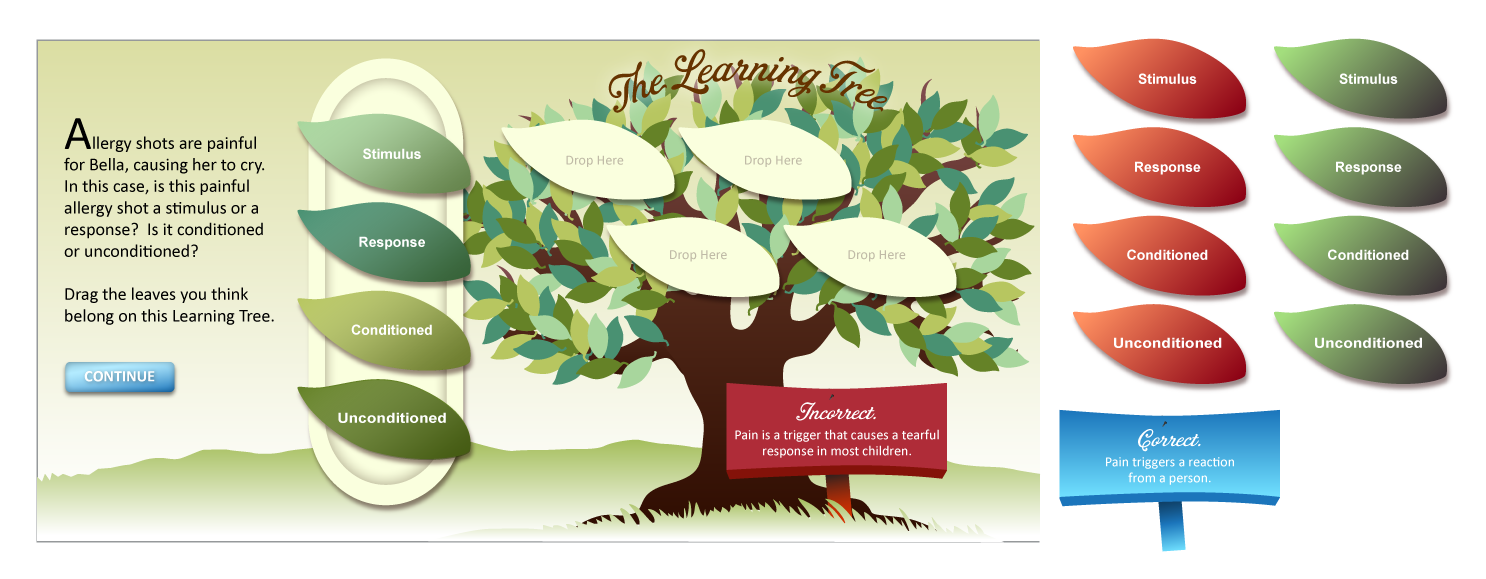
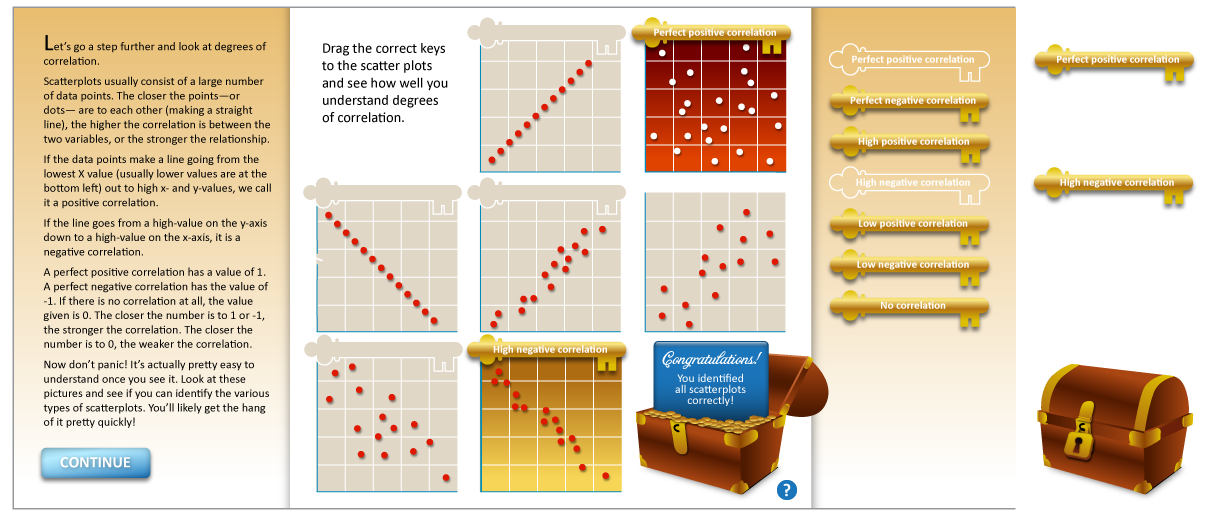
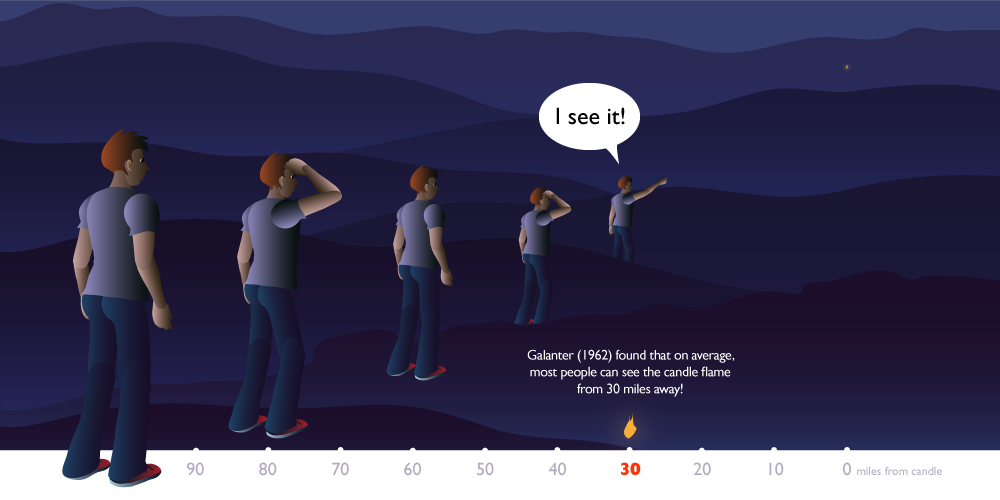
PsychTutor powered by Pearson
Educational illustrations for online and mobile psychology tutorials and interactives // college-level


Discovery Digital Media
BEFORE & AFTER — Redesign infographic for Discovery Digital Media's sales presentation, visualizing their advantages to potential marketers.
The second image shows the original content provided by the client. The first is my redesign.
ABOVE — AFTER REDESIGN
BELOW — BEFORE [CONTENT PROVIDED BY CLIENT]
Junyo, Inc. — Streams
Poster visualizing the potential of big data in creating a more nuanced understanding of student achievement.
More After School, Inc.
Visual representation of the educational model utilized by More After School enrichment program, Westfield, New Jersey
SkyDog
Visualization for funding deck for industry-disrupting start-up, creating home routers with the ability to set controls for individual devices. Intent was to distinguish from existing competitors.
RedLine for Produce
Website banner to introduce tracking software designed for every stage of the produce industry. Included original icon designs.
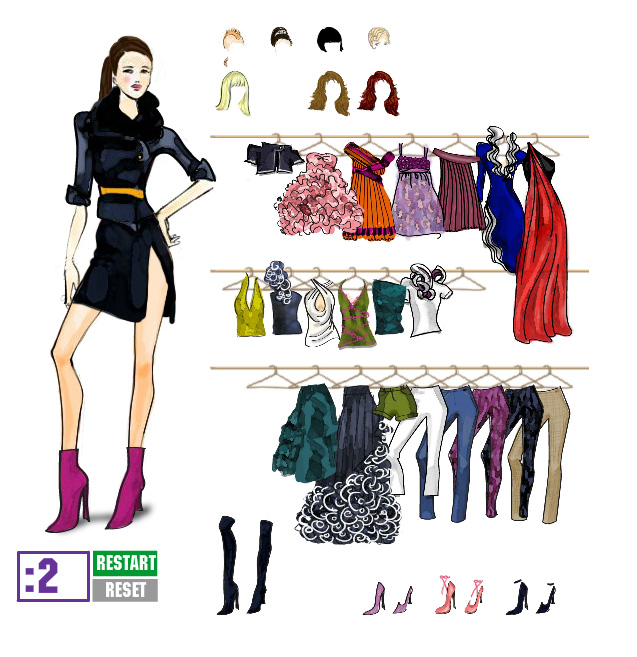
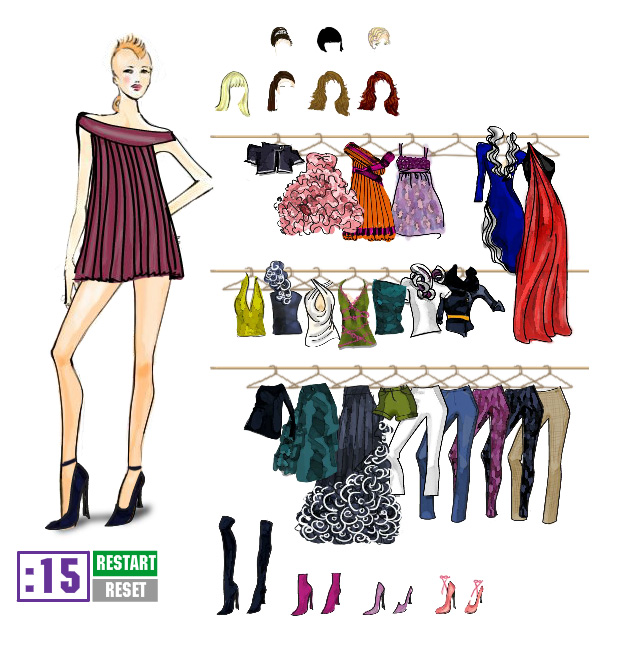
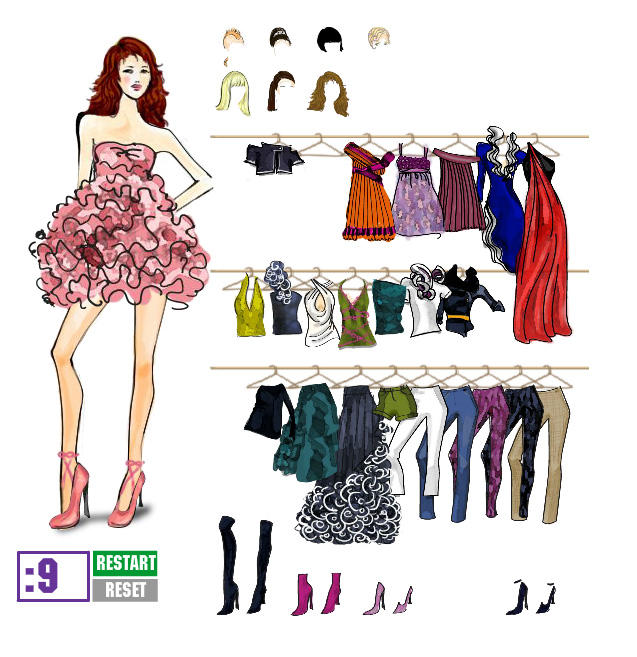
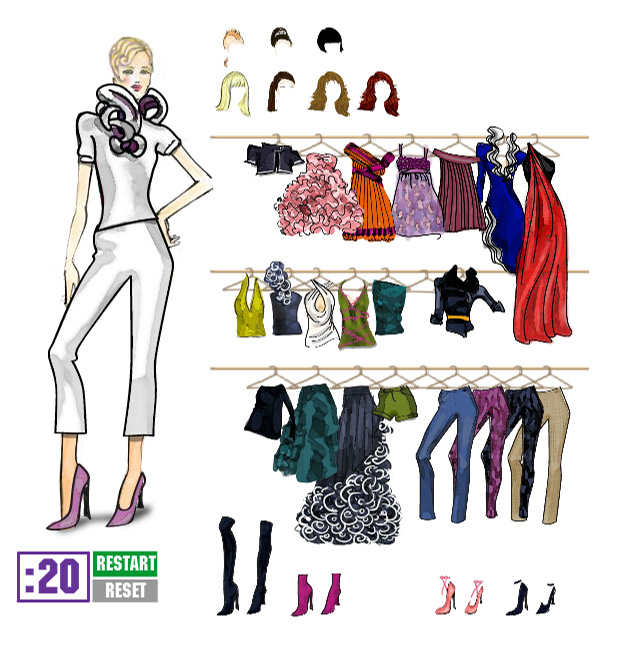
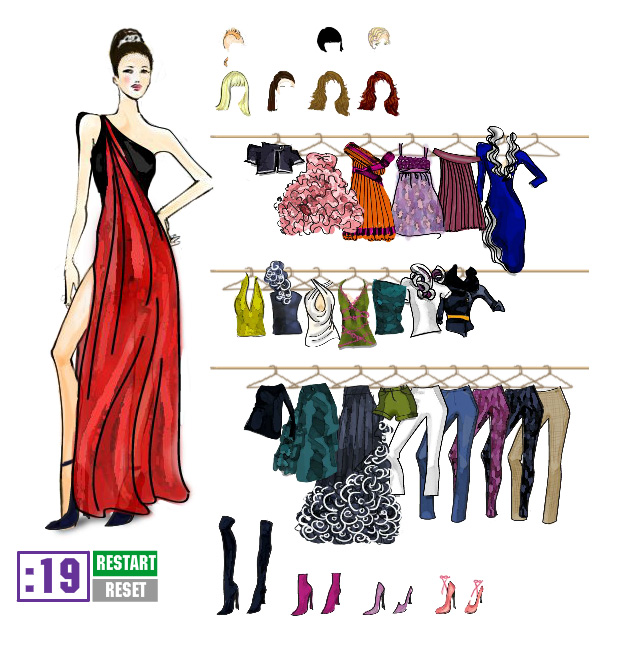
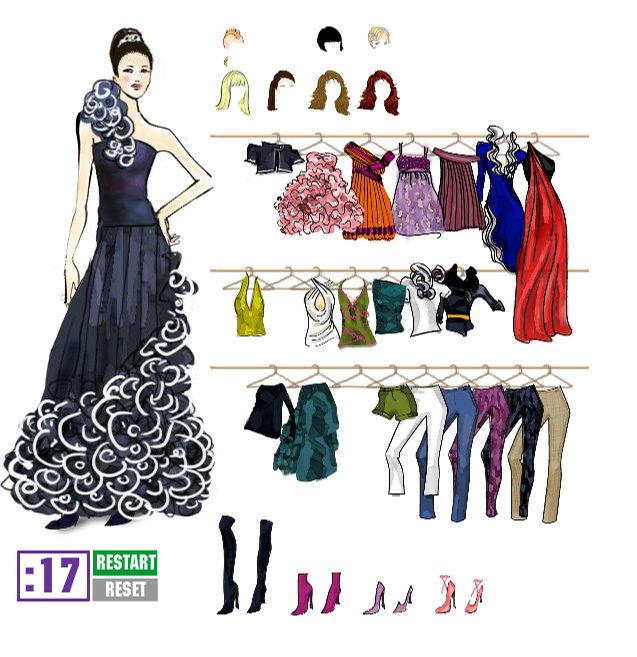
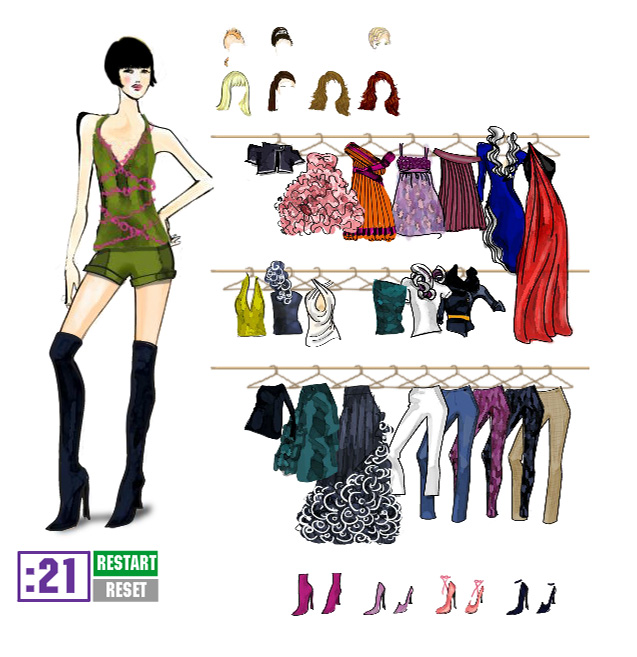
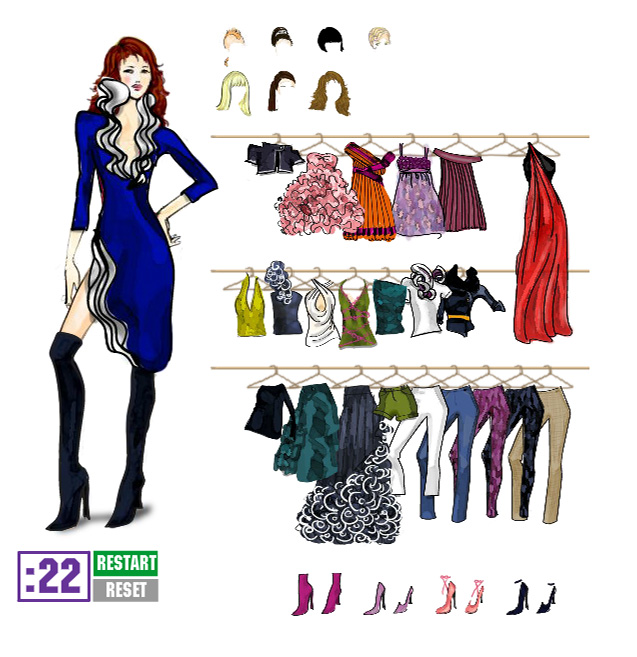
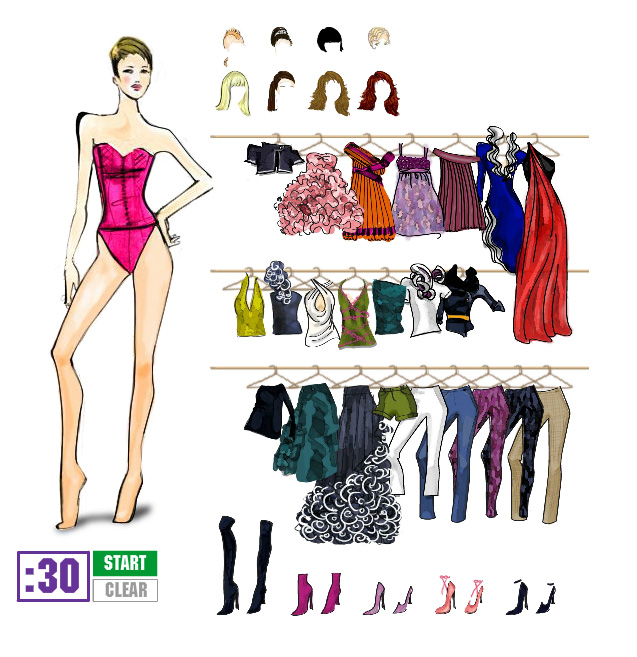
Bravo Cable Network — "The Fashion Show" Interactive
Original design and illustration of paper doll drag and drop game.
Launch interactive version (not available on mobile devices) >

Discovery
Brand-compatible original illustrations and animations